Example
This is a detailed example for the use of this website.
Let's take a simple example of the site functionality. First, let's agree that the initial home page looks like:

Let's take a simple example of inputs (with MCDA clicked).

In this example, we extended the amount of default rows by simply clicking on the button "add row" (you can have 10 rows).
After filling all the details, we can now push submit as get the results.
Notice: It is allowed to fill details for a single twin in per row (and not for both twins).
But you do have to put at least one value for each column.
If you scroll down a little bit, on the results page, you will find the following table of results:

As you can see, the table present varius of metrics,
calculated on the data supplied (for more details, please refer to the about page).
Furthermore, you can view an informative plot of the trend line of the twins, relative to our data.

As you can see, there is a trend line which indicate how the twins located related to the popularity.
In addition, there are to buttons to download the percentages and z-scores of the twins
(presented in the above picture), as tables.
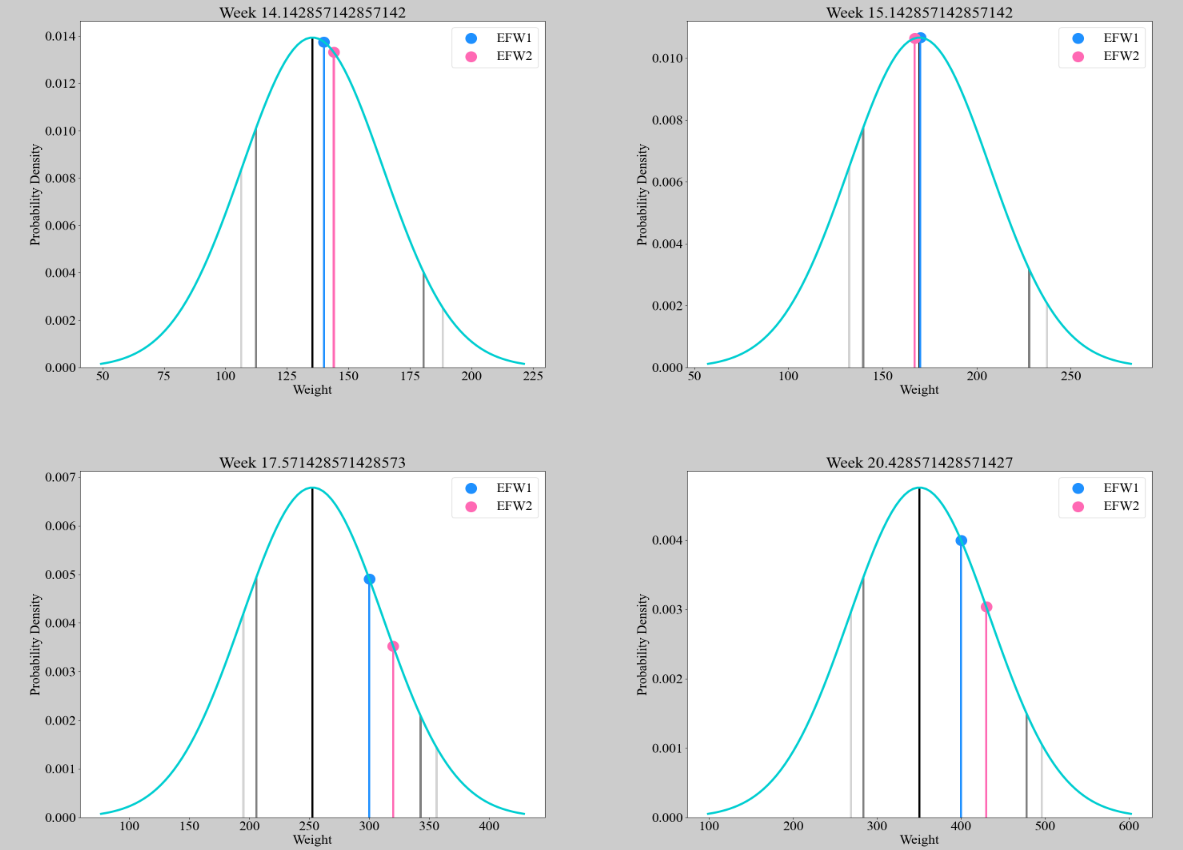
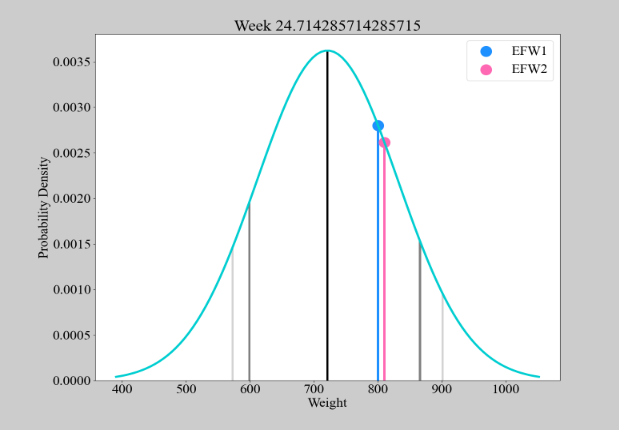
Lastly, there is an "advanced results" button, that presents some Gaussian plots of the twins related to the
distribution.

